Some people do not understand the 8 number distribution, so I will explain it here. Let’s assume that the last 8 numbers that hit your state are these: 578, 276, 397, 223, 348, 035, 121, 142. I am looking for the distribution of the digits. In other words…which digit hit the most times? What is the second hottest digit? Which digit hit the least number of times? As you can see below, the 2 hit the most times. This is the hottest digit in the last 8 drawings.
Digit 2 hit FIVE times (276, 223, 121, 142).
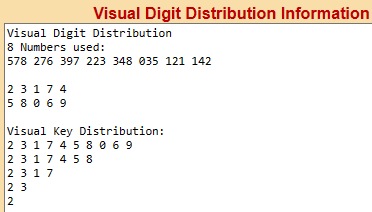
Digit 3 is the second hottest digit; it hit FOUR times (397, 223, 348, 035).
Digit 1 hit THREE times (121, 142)….and so forth.
Notice that 0, 6, 9 hit ONE time. When this happens, the lowest digit is shown first (0) and the highest digit is shown last (9). Same thing with digits 1 and 7; they both hit three times. 1 is shown first because it is the lowest of the two digits.
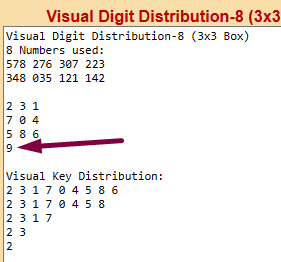
When we line it up (by frequency), the line will be this:
2 3 1 7 4 5 8 0 6 9
Now….let’s turn that into a 3×3 box. We do that by first showing the first three digits (2-3-1). Then the next three digits (7-4-5), then the next three digits (8-0-6). Finally, digit 9. The Visual 8 program does this automatically (see below).
IMPORTANT: 231 is NOT a “number”. It is the distribution of the three hottest digits (2, 3, 1). Same thing with 745; it is NOT a “number”; it is the distribution of digits 7-4-5.

NOTE: Sometimes a digit is missing from the list. The 8-digit distribution program will still show this missing digit. It will be in the last position (lower left). For example, there is no 9 on the list of 8 numbers below. It will be shown in the last position.